用户:Grotton JXz Donbrako/Psychology/Chapter 2+
目录
页面介绍
本页面所转载文章出自APPsychPrep网站所分享幻灯片[1],由GJD转载。
转载时有改动,无任何原内容省略。
正文1
Research Methods: Statistics
- Descriptive statistics describes a set of data.
- How many people have black hair in this room?
- How many people play a musical instrument?
- Measures of Central Tendency describe the center of a data set.
- The measures of central tendency are the Mean, Median, and Mode.
- The Mean or average is the sum of scores divided by the number of scores.
- Sum of scores / Number of days = Mean
- "Find the mean of coffee consumption per day."
- Day 1: 1
- Day 2: 4
- Day 3: 5
- Day 4: 2
- Day 5: 3
- Sum the scores:
- 1+4+5+2+3=15
- Divide the score by the number of days:
- 15/5=3
- "Mean or average is 3 cups / day"
Median is at the midpoint of a frequency distribution, such that there is an equal probability of falling above or below it
- How to find the Median: Put all the numbers in numerical order.
- If there is an odd number of scores, the median is the middle number.
- If there is an even number of scores, the median will be the mean of the two central numbers.
- "What is the median?"
- 6, 2, 9, 4, 7, 3
- Rearrange the numbers:
- 2, 3, 4, 6, 7, 9
- If there is an even number, find mean of middle two:
- 4+6=10. 10/2=5. Five is the median.
- The mean is prone to problems with outliers. Outliers are extreme scores that skew the mean. The median is sometimes a better measure of central tendency when there are outliers.
- Salaries in a company:
- Employee 1: $35,000
- Employee 2: $45,000
- Employee 3: $43, 000
- Employee 4: $400,000
- Mean: $130,750
- Median: $44,000
- The mode is the score that appears most frequently in a set of numbers.
- 4, 5, 6, 7, 7, 7, 7, 8, 5, 5, 6, 6, 8, 3, 2, 4, 4
- What is the mode? 7
- There may be no mode if no value appears more than any other.
- There may also be two modes (bimodal), three modes (trimodal), or four or more modes (multimodal).
Normal Distribution
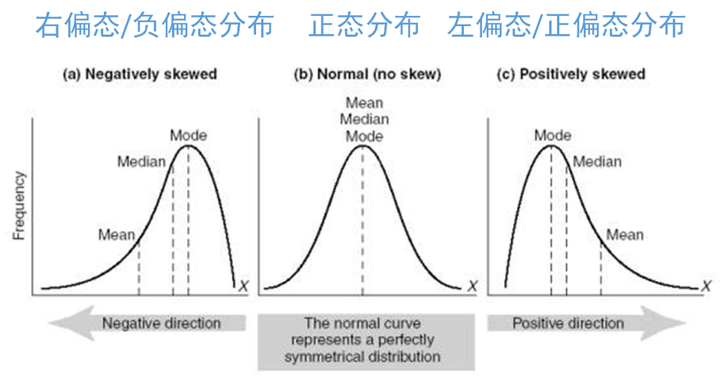
- A Normal distribution' is a function that represents the distribution of many random variables as a symmetrical bell-shaped graph.
- Measures of Central Tendency are a part of a normal distribution.
- The mean, median, and mode of a Standard Normal Distribution are 0
- Normal Distribution, Measures of Central Tendency, and Skew.jpg

- Positively skewed means that a distribution of scores includes an extreme score(s), which give the graph a long tail trailing to the right.
- A negatively skewed distribution contains more high scores than low scores, but a few really low scores result in the graph having a 'long tail' to the left.
正文2
(待补充)