用户:Grotton JXz Donbrako/Psychology/Chapter 2+
目录
页面介绍
本页面所转载文章出自APPsychPrep网站所分享幻灯片[1],由GJD转载。
转载时有改动,无任何原内容省略。
正文1
Research Methods: Statistics
- Descriptive statistics describes a set of data.
- How many people have black hair in this room?
- How many people play a musical instrument?
- Measures of Central Tendency describe the center of a data set.
- The measures of central tendency are the Mean, Median, and Mode.
- The Mean or average is the sum of scores divided by the number of scores.
- Sum of scores / Number of days = Mean
- "Find the mean of coffee consumption per day."
- Day 1: 1
- Day 2: 4
- Day 3: 5
- Day 4: 2
- Day 5: 3
- Sum the scores:
- 1+4+5+2+3=15
- Divide the score by the number of days:
- 15/5=3
- "Mean or average is 3 cups / day"
Median is at the midpoint of a frequency distribution, such that there is an equal probability of falling above or below it
- How to find the Median: Put all the numbers in numerical order.
- If there is an odd number of scores, the median is the middle number.
- If there is an even number of scores, the median will be the mean of the two central numbers.
- "What is the median?"
- 6, 2, 9, 4, 7, 3
- Rearrange the numbers:
- 2, 3, 4, 6, 7, 9
- If there is an even number, find mean of middle two:
- 4+6=10. 10/2=5. Five is the median.
- The mean is prone to problems with outliers. Outliers are extreme scores that skew the mean. The median is sometimes a better measure of central tendency when there are outliers.
- Salaries in a company:
- Employee 1: $35,000
- Employee 2: $45,000
- Employee 3: $43, 000
- Employee 4: $400,000
- Mean: $130,750
- Median: $44,000
- The mode is the score that appears most frequently in a set of numbers.
- 4, 5, 6, 7, 7, 7, 7, 8, 5, 5, 6, 6, 8, 3, 2, 4, 4
- What is the mode? 7
- There may be no mode if no value appears more than any other.
- There may also be two modes (bimodal), three modes (trimodal), or four or more modes (multimodal).
Normal Distribution
- A Normal distribution' is a function that represents the distribution of many random variables as a symmetrical bell-shaped graph.
- Measures of Central Tendency are a part of a normal distribution.
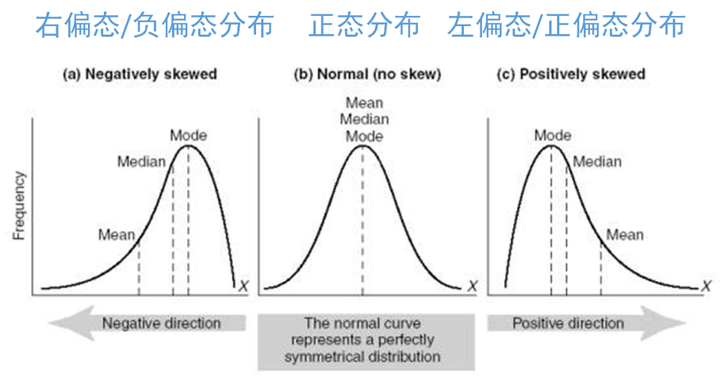
- The mean, median, and mode of a Standard Normal Distribution are 0
- Normal Distribution, Measures of Central Tendency, and Skew.jpg

- Positively skewed means that a distribution of scores includes an extreme score(s), which give the graph a long tail trailing to the right.
- A negatively skewed distribution contains more high scores than low scores, but a few really low scores result in the graph having a 'long tail' to the left.
正文2
Measures of Variability
- Measures of Variability are statistics that describe the amount of difference and spread in a data set.
- For this lesson the measures of variability are the range, variance, standard deviation.
Range
- The range is the distance between the highest and the lowest score in a distribution.
- If the highest score is 75 and the lowest score is 25, what is the range? 25 - 75
- If the highest score is 10 and the lowest score is 1, what is the range? 1 - 10
Variance
- Variance is the dispersion from the mean.
- In a wide variety of cases, we are trying to measure dispersion from the mean due to a multitude of chance effects.
- In other words, the variance measures how much things differ from the average.
Standard Deviation
- The standard deviation is a statistic that tells you how tightly all the various examples are clustered around the mean in a set of data.
- When examples are tightly bunched together and the shape of the curve is steep, the standard deviation (and the variance) is small. When the examples are spread out and the curve is flat, then the standard deviation (and variance) is large.
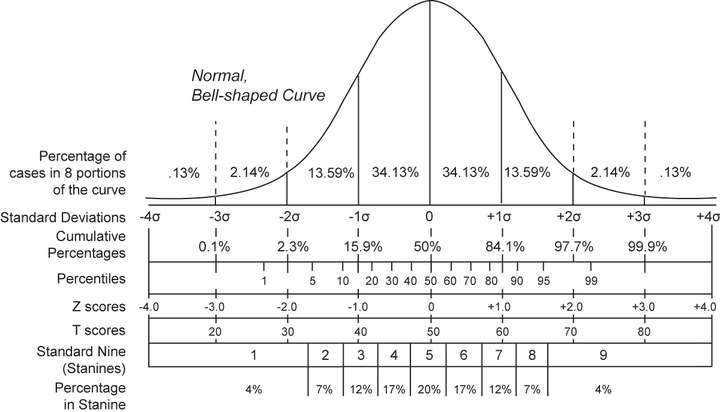
- The Standard Normal Distribution(SND) is a theoretical bell-shaped curve.
- Roughly
68 % of scores in a SND fall within one standard deviation of the mean, approximately95 % of scores fall within two standard deviations of the mean, and99.7 % of sores fall within three standard deviations of the mean.

Z Scores
- Z-scores measure the distance of a score away from the mean; z-score of a value tells how many standard deviations the value is from the mean.
- Percentile ranking indicates the distance of a score from 0.
- "Someone who scores in the 90th percentile on a test has scored better than 90 percent of the people who took the test. Someone who scores at the 38th percentile scored better than only 38 per cent of the people who took the test."
- "Someone who scores at the 50th percentile has a Z score of 0, and someone who scores at the 98th percentile has an approximate Z score of +2"
- What is my z-score if I am in the 99.9 percentile?
